WELCOME TO FutureFunds Oracle
FUTURE FUNDS ORACLE uses smart maths to predict about what people might do with their money. It also assist financial institutions in understanding customer behaviour and identifying potential subscribers accurately. By uncovering patterns and trends within the data.

Data Visualization
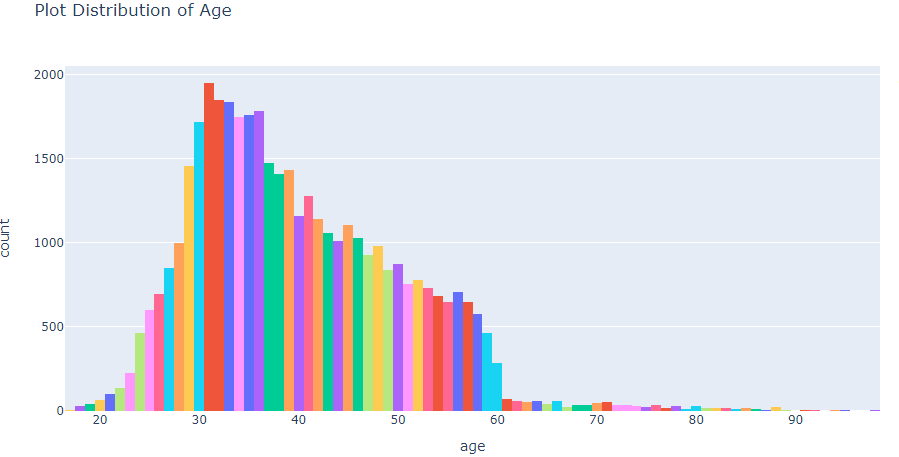
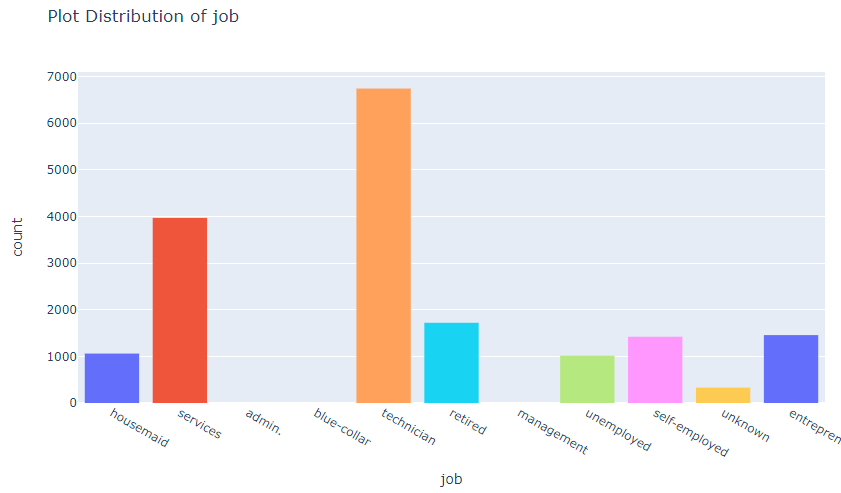
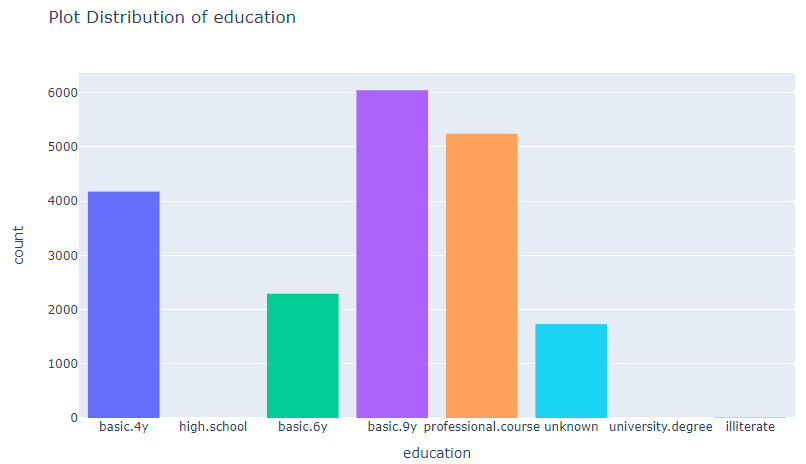
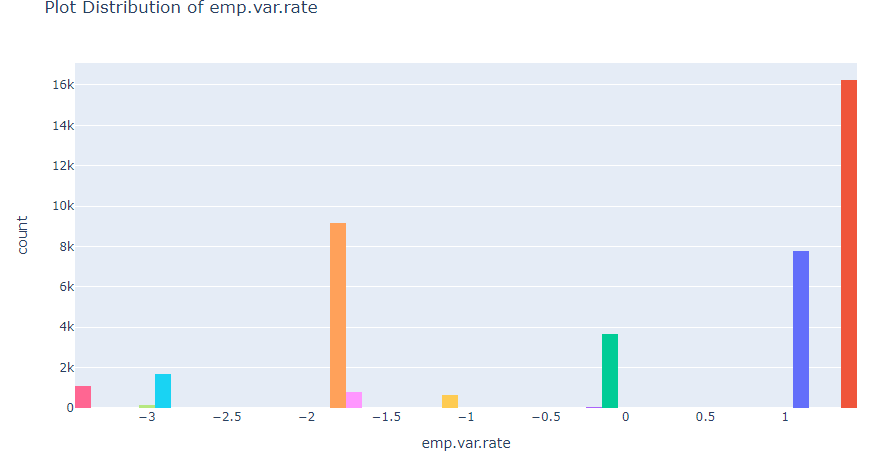
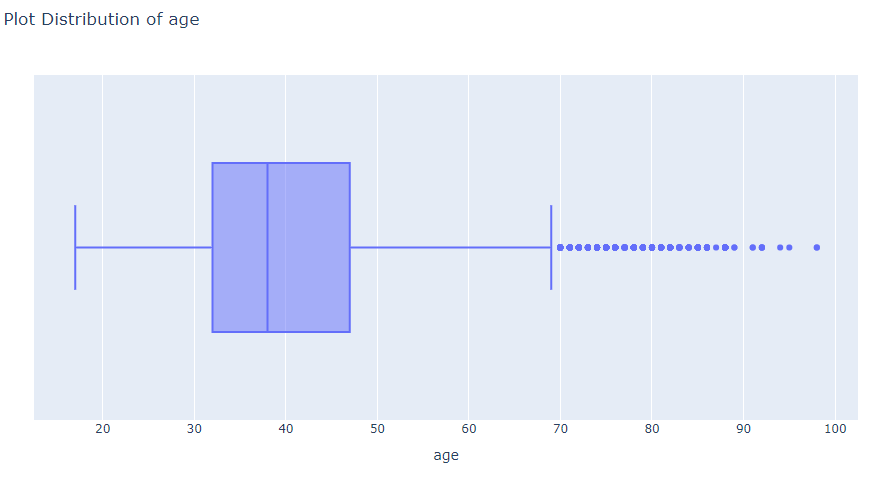
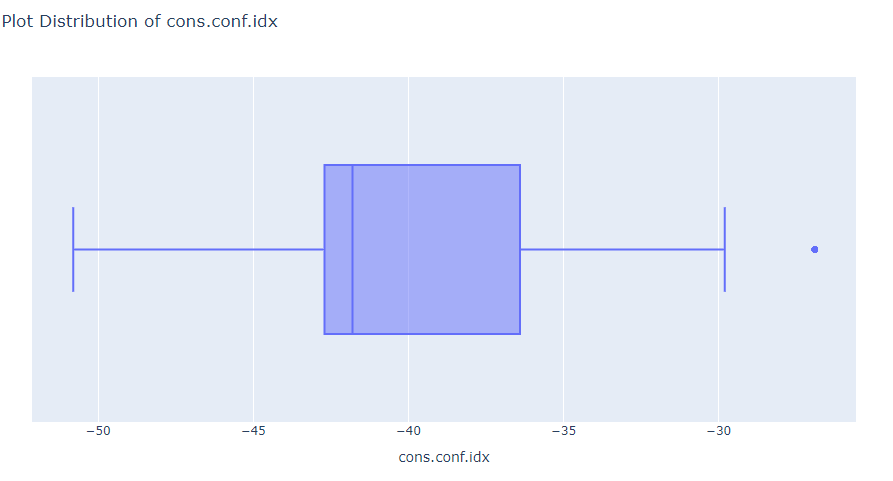
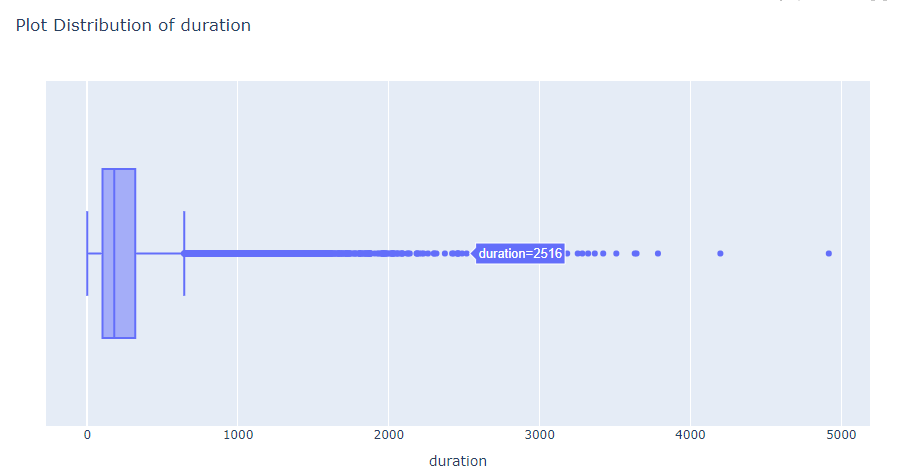
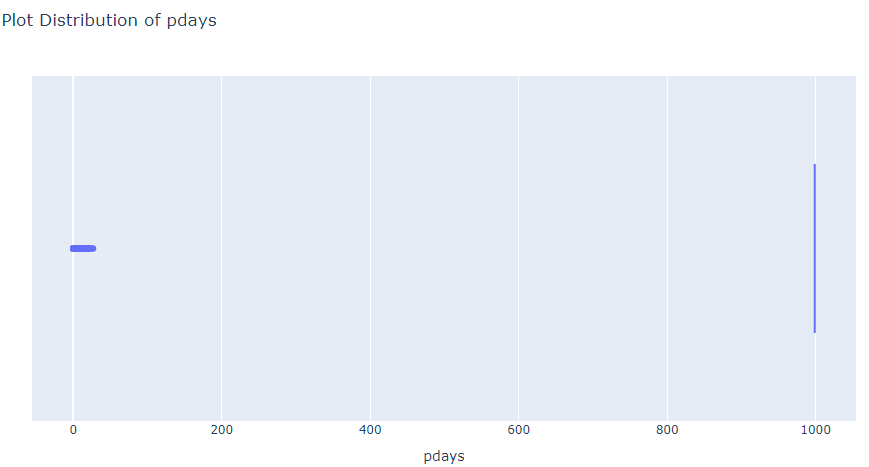
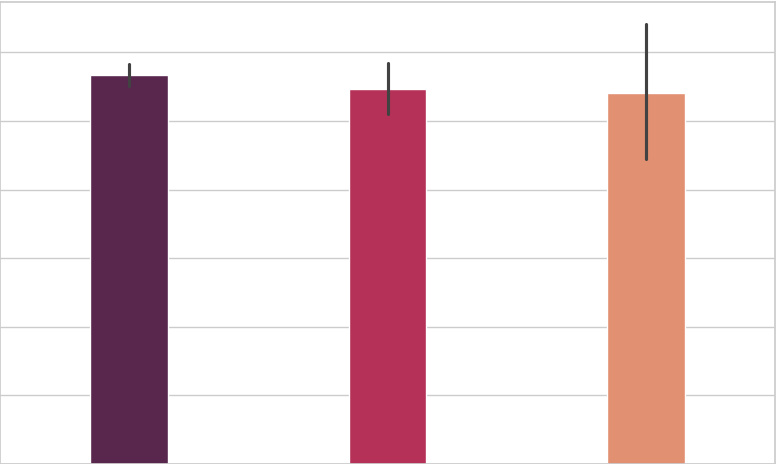
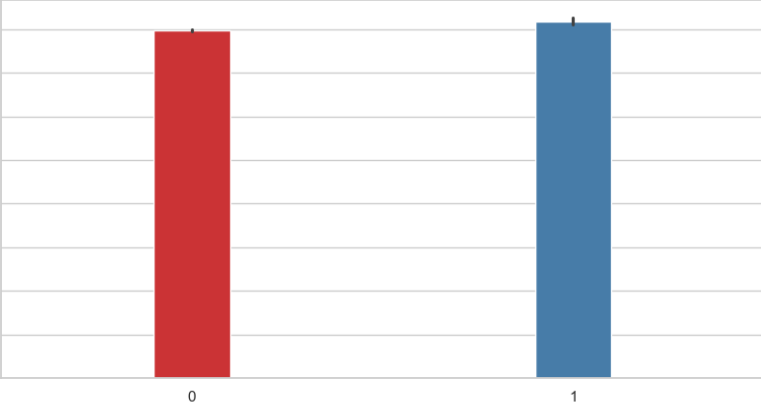
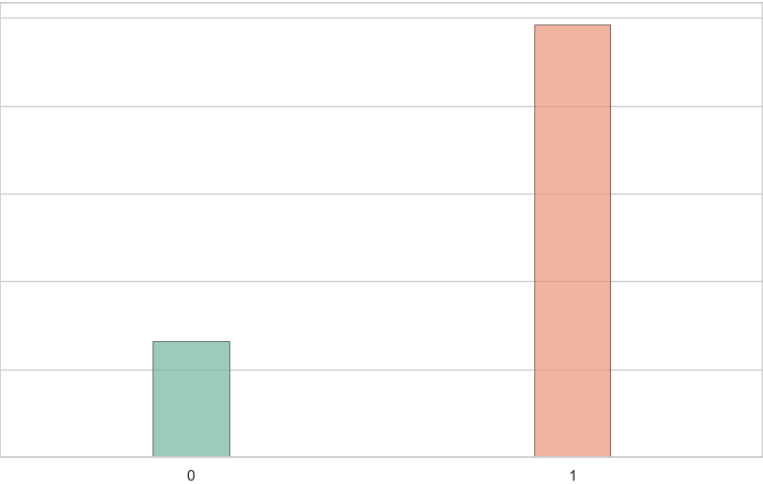
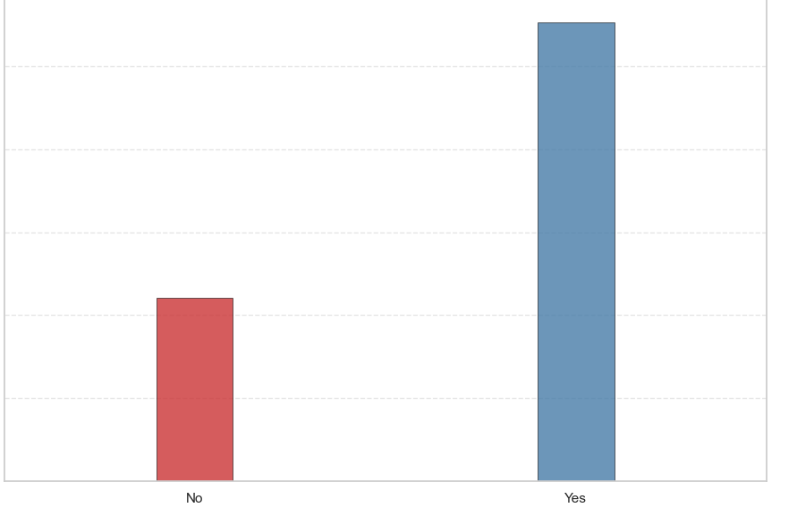
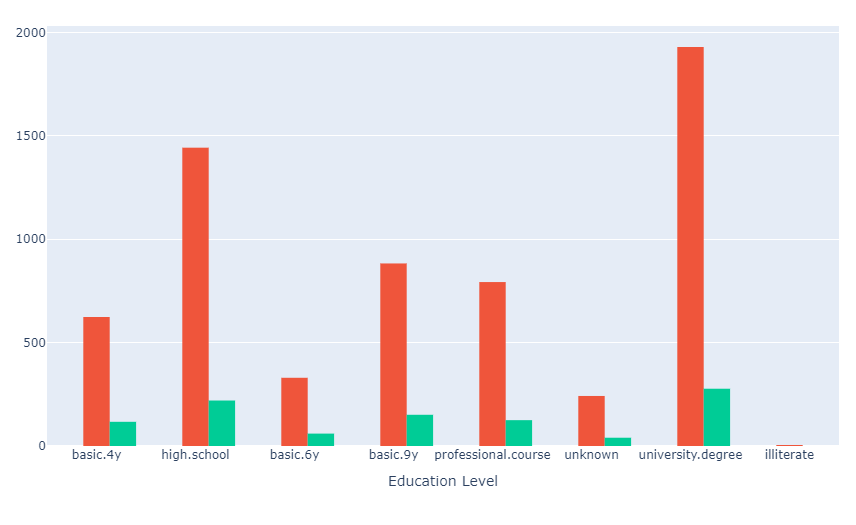
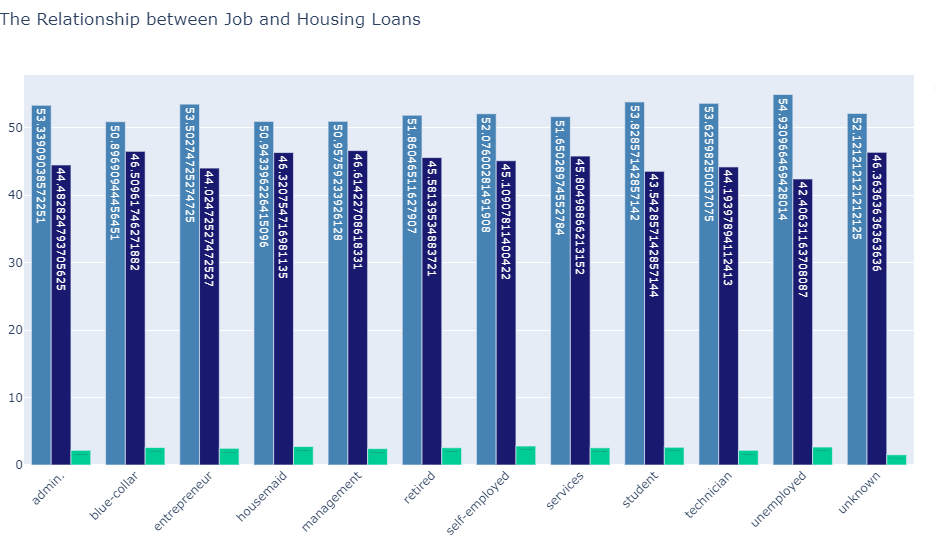
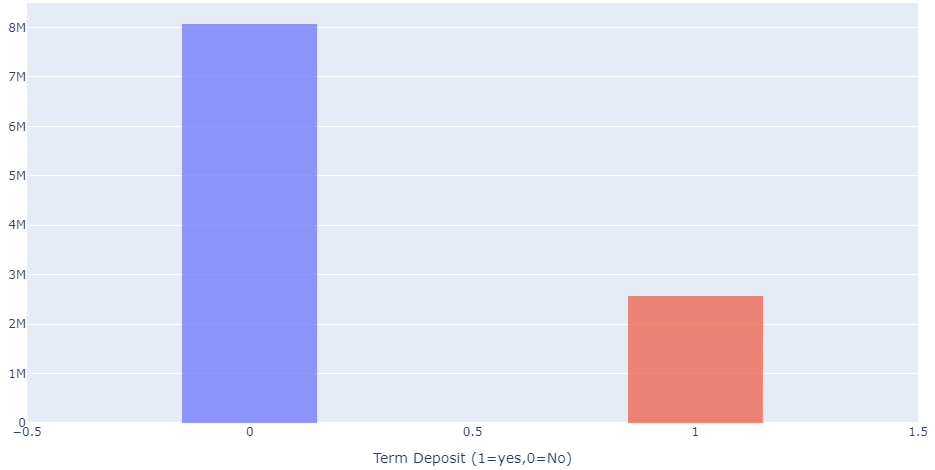
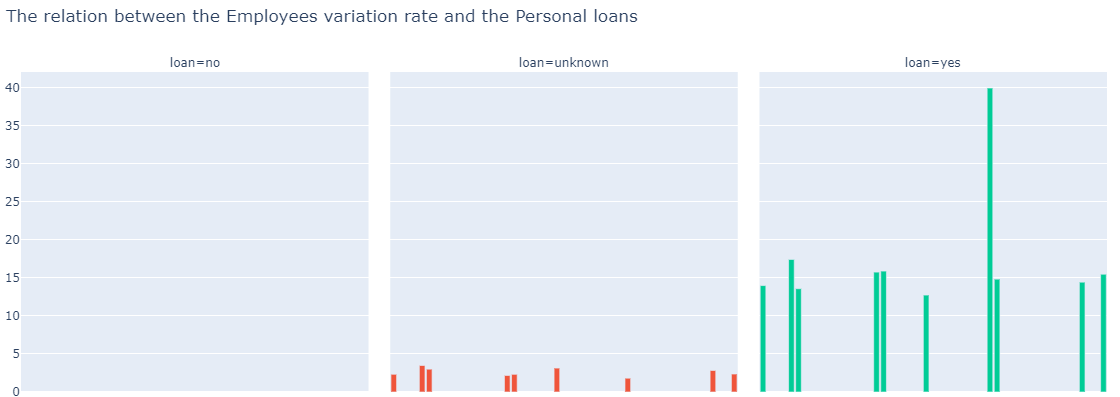
Data Visualization involves presenting data in a graphical or visual formats like charts,graphs,or maps. We have used data visualization to make complex information easier to understand and analyze.To understand complex ideas more easily we can analyse the patterns ,trends.Through visuals we can understand corelations between features.These visuals make it easier to spot important stuff in the data. They are like maps that guide us through the data jungle. It plays an important role in exploratory data analysis which can lead to the more accurate results. Some of the plots like Box plot,Histogram,Bar plot etc are described below.
